The Trans Policy Crisis
The attack on trans rights in the United States is worse than you think.
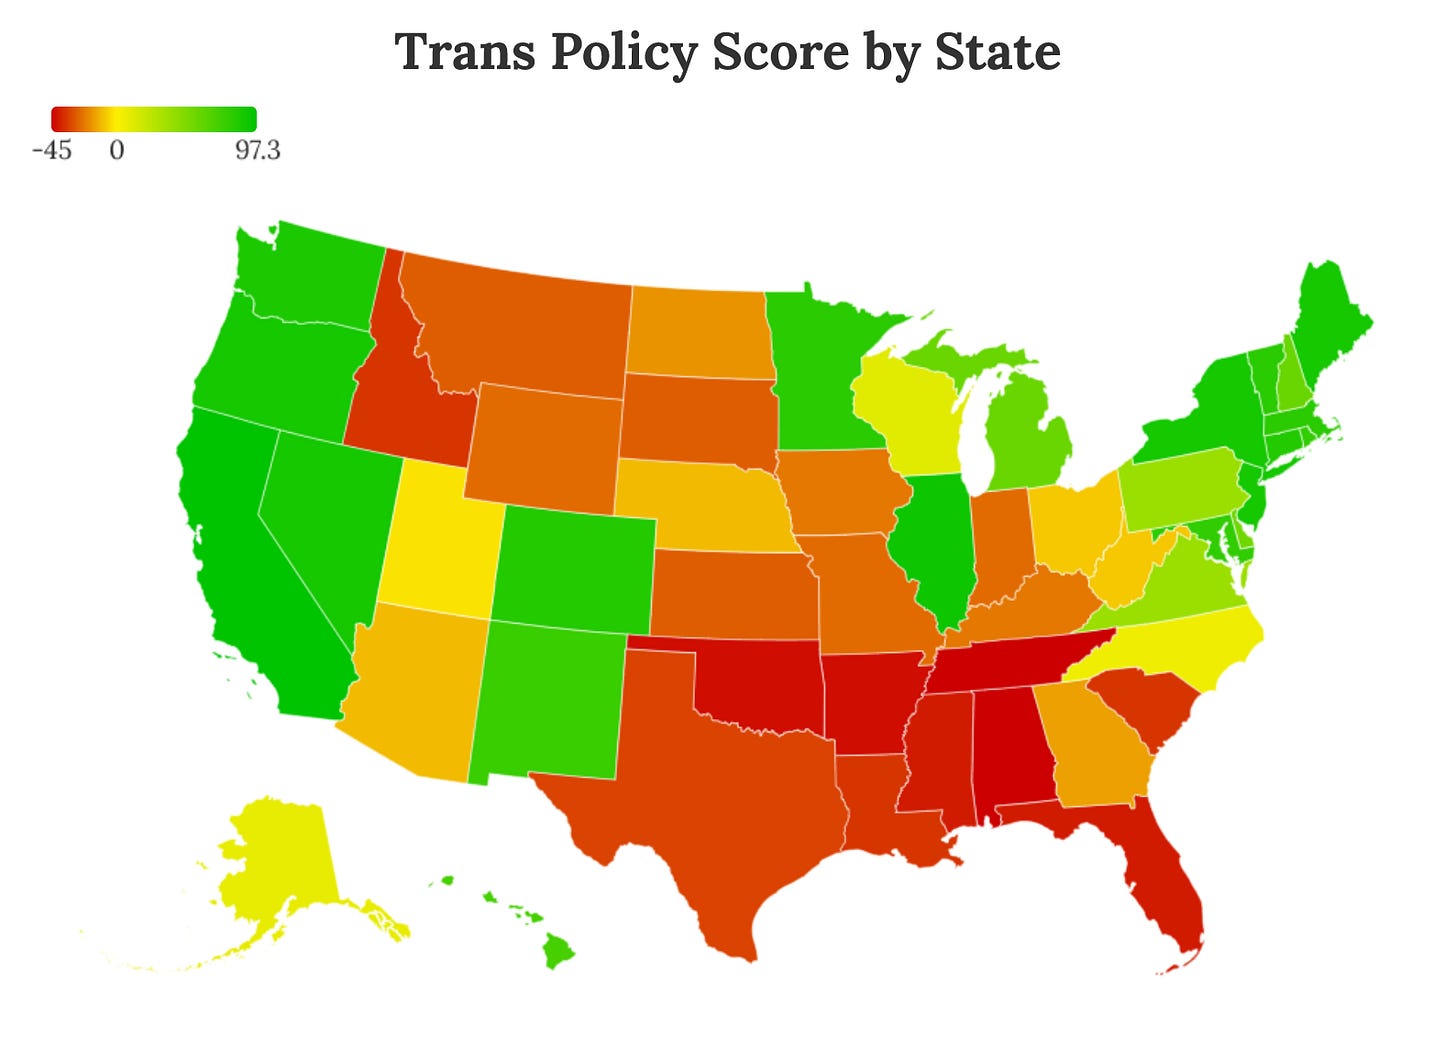
This is the second article in my Anti-Trans Tipping Point series. In this series, I interrogate the state of trans rights in the United States, how we arrived here, and what we should do next to advance trans liberation. You can find the introduction here.
Discussing politics without discussing policy is a pointless endeavor. Yes, policy can be a dry, tedious subject. But policy not only dictates how society works but sets precedents and legitimizes cultural attitudes and norms. Because of this, we cannot fully understand the anti-trans backlash without an in-depth investigation into trans policies first. It’s so important that I specifically listed the Policy Crisis as the first of three major issues facing trans rights activists within the United States in my previous article.
In this installment of the Anti-Trans Tipping Point, I will elaborate further on the Policy Crisis through an exploration of trans policies across the country. Because searching through policy is a herculean effort, I will focus on the evolution of state-level policies between 2004, a decade before the Trans Tipping Point, and 2024, a decade after. Policies from Washington, DC and the US territories are not included due to unique factors associated with them. Federal-level policies are also not included for one simple reason: as far as I can tell, the first anti-trans federal law passed in 2024. Trans rights -- and, more broadly, LGBTQ+ rights as a whole -- have historically been more of a states rights issue than a federal one, a phenomenon I will discuss further in a future article. While it is definitely possible for this to change in the very near future, federal policies are exempt from this analysis for the time being.
Please note that this installment will be particularly numbers-heavy. In order to make the information easier to process, I have created a number of interactive graphs to visualize the data presented.
An Overview of LGBTQ+ Legislation
When I started this project, I was quickly overwhelmed by the sheer magnitude of policies to sort through and identify. Fortunately, I am far from the first person to consider documenting the development of LGBTQ-related policies in the United States. Funnily enough, the Human Rights Campaign actually began issuing their yearly State Equality Index (SEI) in 2004 -- a particularly helpful coincidence. The SEI looks at the number of LGBTQ-related bills introduced and passed in state legislatures and classifies them as pro-LGBTQ+ or anti-LGBTQ+. Through information from the SEI, we can get an initial glimpse into the evolution of LGBTQ+ legislation within the country.
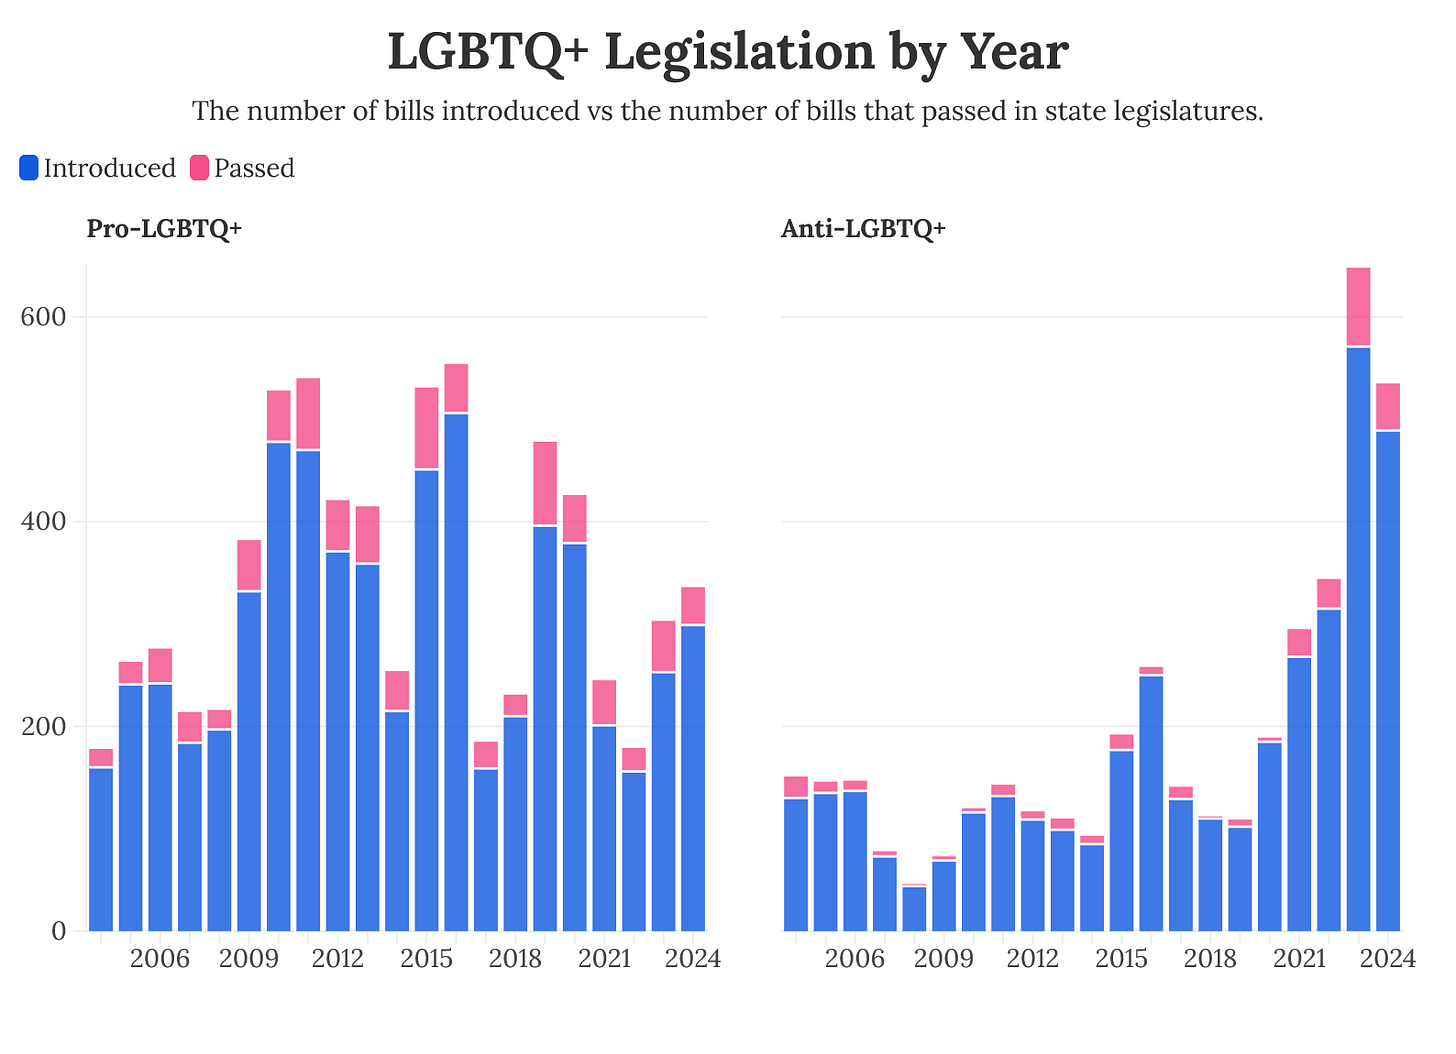
From this data we can make a couple noteworthy observations. Firstly, there are two peaks when it comes to pro-LGBTQ+ legislation: 2016, which had the highest number of pro-LGBTQ+ bills introduced (506), and 2019, which had the highest number of pro-LGBTQ+ bills passed (82). For anti-LGBTQ+ legislation, 2023 marked the year where the US saw the highest number of anti-LGBTQ+ bills introduced and passed (571 and 77, respectively).
Secondly, and perhaps surprisingly, pro-LGBTQ+ legislation was generally more popular than anti-LGBTQ+ legislation prior to 2021. Between 2004 and 2020, pro-LGBTQ+ legislation was over 2.5 times more likely to be introduced and 2 times as likely to become law. After 2020, however, anti-LGBTQ+ legislation was nearly 2 times as likely to be introduced. Although pro-LGBTQ+ bills were still more likely to become law, they were only 1.5 times more likely.
This is undoubtedly a disturbing trend. It’s also a trend that reflects my previous argument that 2021 marked the Anti-Trans Tipping Point. However, this information, while useful, does not necessarily reveal to what extent trans people are being targeted explicitly. For all we know, the sudden uptick in anti-LGBTQ+ bills could have been a delayed reaction to the peak in 2016, or the year after Obergefell v. Hodges happened. In order to get better insight into trans-specific policies, we have to look elsewhere.
Quantifying the Equality Map
For almost two decades, the Movement Advancement Project (MAP) has tracked LGBTQ+ policies across the country. MAP has presented their findings since at least 2011 through the Equality Map, an easy-to-use resource that presents LGBTQ-related policies active in every state. All policy areas covered by the Equality Map are accompanied by a list of citations that explains when each policy was adopted and provides links to relevant documents.
Using information provided by the Equality Map as a guide, I tracked the development of dozens of policies across the country. Based on these policies, I developed a scoring method and assigned each state three separate annual scores between -100 and 100. The first score is the Gender Identity (GI) Score for policies specific to trans people. As the history of trans rights is inseparable from the history of gay rights, each state also received a Sexual Orientation (SO) Score for policies that impact LGBQ+ people, cis or trans. When these two scores are combined, they form the third score, or the Total Score. For more information about my methodology, please consult the Methodology section at the end of this article.
When the scores from all 50 states are added together, we find the following results.
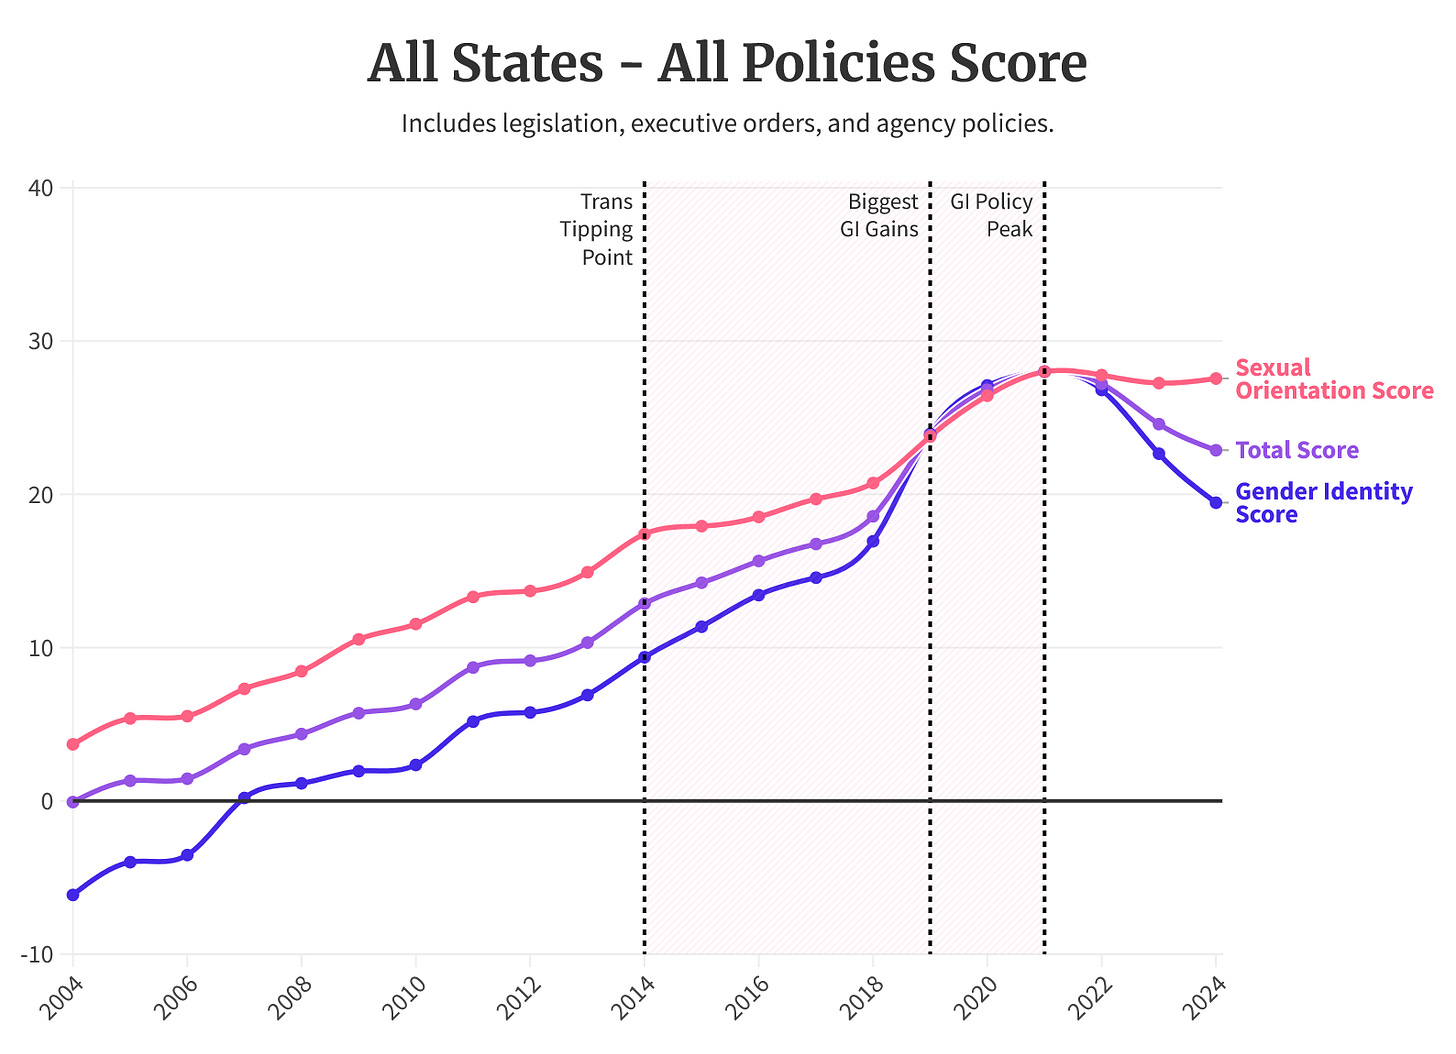
On this chart, I’ve marked three pivotal years and shaded the area in between with pink. The first year is 2014, the Trans Tipping Point. At that point, LGBTQ+ rights as a whole were gradually increasing, although the SO Score was over 1.5 times higher than the GI Score. 2019 is our next notable year for two reasons: firstly, the GI Score jumped up by 7 points, the biggest gain of any category in the past two decades; and secondly, the GI Score officially surpassed the SO Score by a slight margin. This jump in 2019 matches the peak that we previously saw in the SEI’s legislation scores. Finally, in 2021, all three scores peaked at 28.00. Three years later, the GI Score plummeted down to 19.46, a 30% decrease, while the SO Score sat at 27.56.
Thanks to the Equality Map, we have finally clarified that the recent barrage of anti-LGBTQ+ legislation as highlighted by the SEI primarily targets trans people. From here, we can ask another critical question: how evenly distributed are trans policies among the 50 states? Are there some areas that are particularly better or worse than others?
A Nation Divided
The United States Census divides the country up into four regions: the Northeast, Midwest, South, and West & Pacific states. When policy scores are divided upon Census regions, the anti-trans political trend becomes much clearer -- and more alarming.

Between 2021 and 2024, the only region that saw an improvement in its GI score was the Northeast, which increased by 3.85 points (about 6%). The other regions fared far worse: the West and Pacific decreased by 7.03 (16%); the Midwest by 10.65 (56%); and the South, whose GI score has never been higher than 0, by an astounding 13.84 points (nearly 800%).
This staggering decline could be enough to declare a policy crisis on its own, but there is yet another crucial piece of the puzzle missing. The scores above are the results when all policies are included -- that is, laws, executive orders, agency policies, and court rulings -- as opposed to laws on their own. While all four policy types hold equal weight when it comes to dictating daily operations and procedures, it’s a far different story when it comes to implementing and repealing them.
Executive orders, agency policies, and court rulings similar to one another: generally, they are decisions made by at least one official. Oftentimes, these officials are appointed rather than elected, such as judges or the secretaries of state agencies. Laws, on the other hand, require the collaboration of dozens to hundreds of elected officials and countless hours to be passed. This process is so grueling that the vast majority of introduced bills don’t even make it past the first step of the legislative process.
When it comes to policy change, then, it’s often quicker and more efficient to bypass the legislature. For instance, if trans activists wanted to make it easier to amend the sex marker on a birth certificate, then it could be advantageous to work directly with the Secretary of Health in their state. After all, the Secretary of Health might be able to change agency rules before a bill doing the same thing even left committee. Additionally, if the state legislature is apathetic or hostile to the idea, then having the support of the Secretary of Health would be the most plausible way of implementing that change.
Although executive orders, agency policies, and court rulings can be tremendously helpful, there is also a significant downside: they are far easier to overturn. If one governor implements an executive order, for instance, the next one can repeal it with an executive order of their own. A change in agency leadership can result in sudden regulatory and procedural upheaval. A victorious court ruling can be overruled if a determined party takes the case to another judge. But a legislature that passed a law is far less likely to replace it with another law in the near future. Ironically, it is the difficulty inherent to the legislative process that makes laws far more stable than all other policies.
With this in mind, I re-examined the policies from before but with a new caveat: only laws would be counted this time. This includes laws that are still on the books even if a court ruling is currently preventing it from being enforced, such as same-sex marriage bans that are unenforceable due to Obergefell v. Hodges. With all non-laws excluded, we find a far more dire portrait of LGBTQ+ rights in the US.

While the trend we observed earlier remains, the scores are far worse. For instance, when comparing the 2024 GI Scores from both graphs, the Northeast dropped by 24.32 points (33%); the West and Pacific by 13.31 (35%); the Midwest by 22.01 (264%); and the South by 0.72 (5%). SO Scores did not fare much better, like in the Midwest, where the SO score tumbled by nearly 30 points (140%).
The dip that occurs when shifting the focus from all policies to laws only is so severe that some scores -- like every score category in the Midwest -- become negative. This means that while there are generally more pro-LGBTQ+ policies than anti-LGBTQ+ policies in place, the gap between pro- and anti-LGBTQ+ laws is much smaller. To be more precise, approximately 2 in 3 pro-LGBTQ+ policies are law as compared to 9 in 10 anti-LGBTQ+ policies.
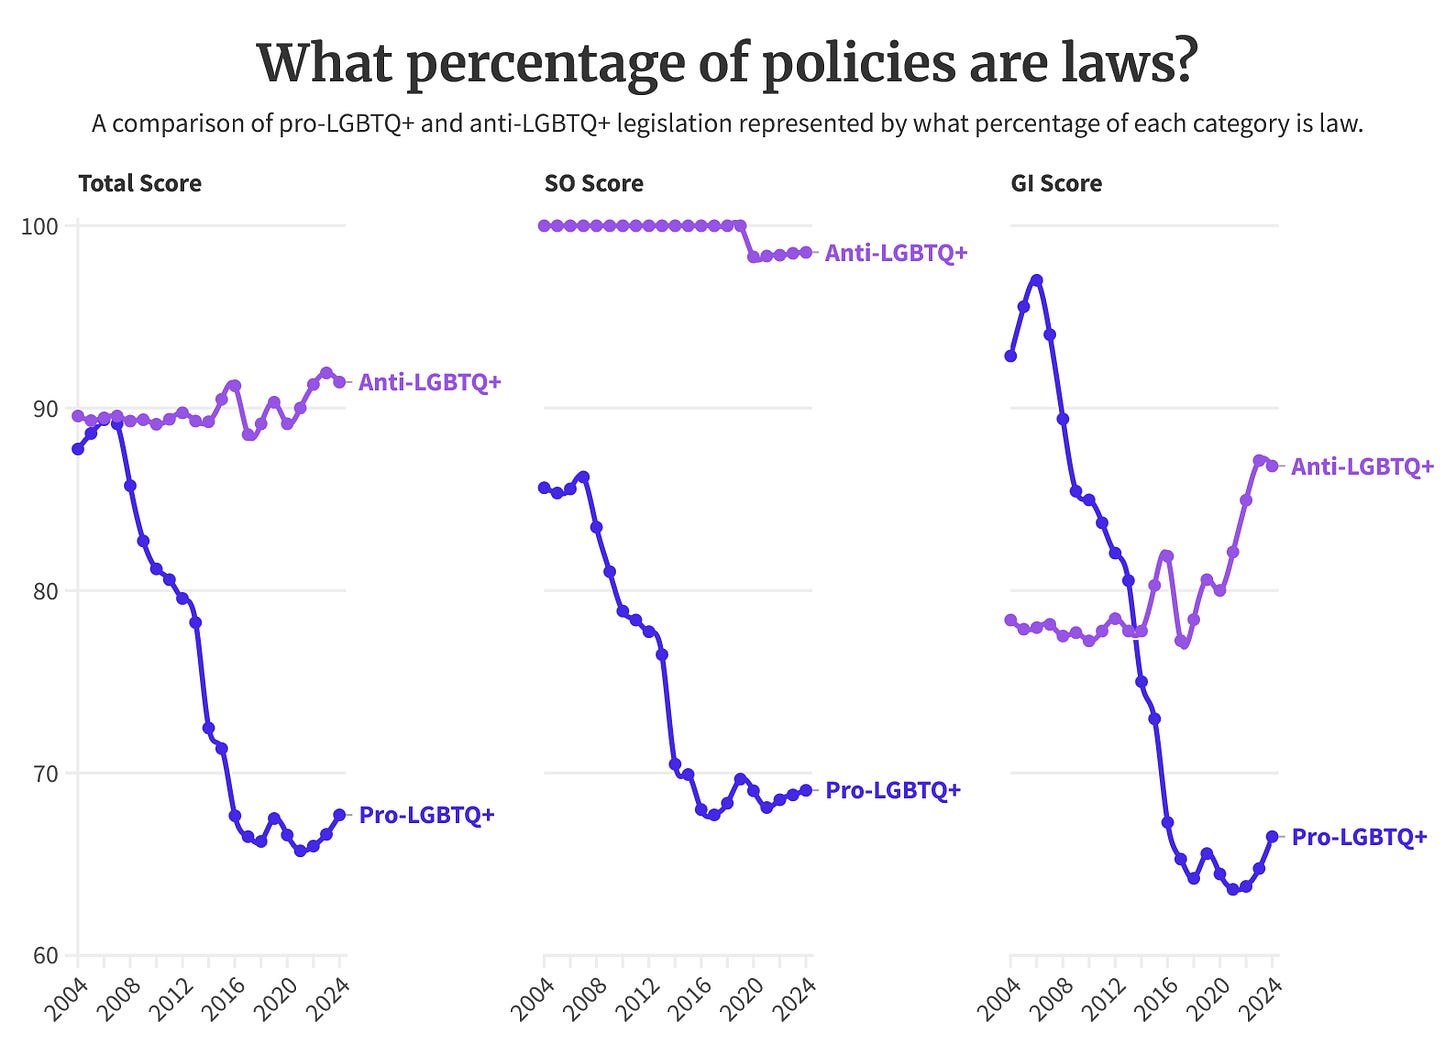
Even worse, the percentage of pro-LGBTQ+ laws has significantly decreased: in 2006, 89.37% of pro-LGBTQ+ policies were law, while in 2021, only 65.73% were law. That means that of the nearly 300 pro-LGBTQ+ policies that went into effect during that time frame, nearly half of them were not laws. Meanwhile, the percentage of anti-LGBQ+ policies that are laws has remained at or near 100% for 20 years.
When it comes to trans-specific policies, however, we see a different story. Interestingly enough, pro-trans policies were more likely to be law than anti-trans policies until 2014. The sudden 7% drop that year resulted from a flurry of policy changes led by governors and state agencies across the nation. Meanwhile, the proportion of anti-trans laws increased by 5% between 2014 and 2016. While much of this increase was undoubtedly related to the wave of religious exemption laws passed in the wake of Obergefell v. Hodges, the anti-trans backlash had officially begun. 2014 was indeed the Transgender Tipping Point, although perhaps not in the way Time magazine might have suspected.
It’s this discrepancy in the proportion of pro-LGBTQ+ and anti-LGBTQ+ laws that I am calling the Policy Crisis. Succinctly put, policies that protect LGBTQ+ rights are far more vulnerable than policies that erode them. The significant progress made throughout the 2010s were victories that ultimately existed on a shaky foundation. As soon as reactionaries knew what to look for -- as soon as they knew to make a concentrated political effort against trans people -- the winning streak came to a very abrupt end. In the next installment of this series, I’ll explore the failures and limitations of pro-trans rhetoric against this backlash more in depth.
Disproportionate Impacts
As the biggest region of the United States, it isn’t necessarily surprising to know that the South has the most anti-trans policies in the country. Approximately one-third of US states are classified as Southern states; it should follow that, if anti-trans policies were evenly distributed, the same amount would appear in the South. In reality, we find that over 50% of anti-trans policies have been implemented in Southern states.
When it comes to pro-trans policies, the situation is even worse. Again, over 50% of pro-trans policies are located in one region. This time, though, they’re located in the Northeast -- the smallest region of the country, encompassing just under a fifth of all states.
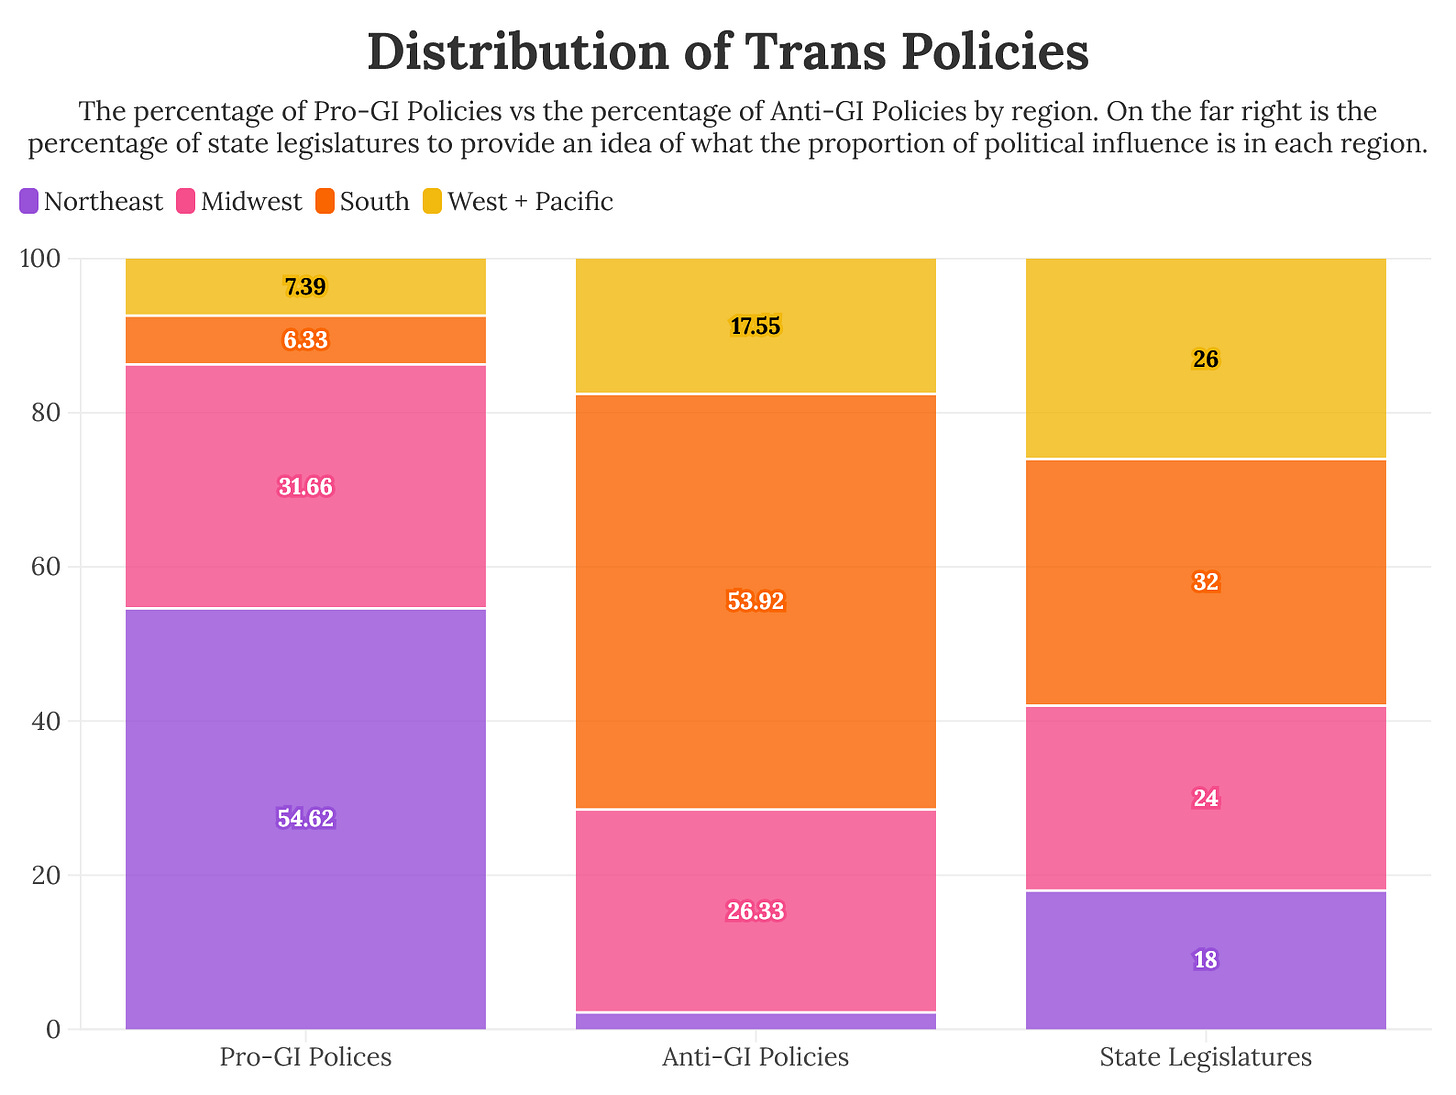
Certainly, the fact that the most anti-trans region of the country happens to be the largest region of the country is alarming. Yet despite discussion about which states are the safest and most dangerous for trans people, much less has been said about where trans Americans actually live. This is essential information to know; how else can we gauge the actual level of risk experienced by the millions of trans people across the nation?
Unfortunately, information on this question is limited. Thankfully, the Williams Institute provided estimates in 2022 about the number of trans people in the United States. When combining these estimates with the 2020 United States Census, we can create a rough picture of the trans demographics in the United States.
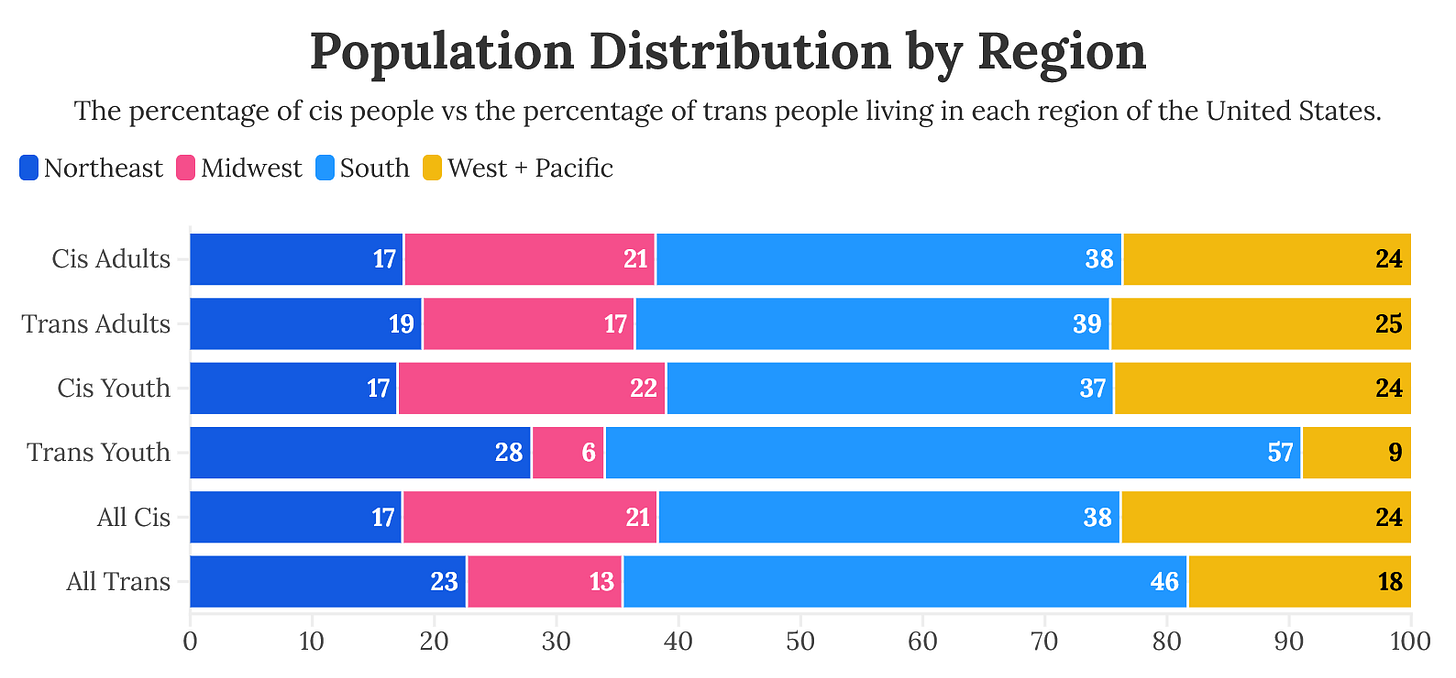
Based on current estimates, the South is unsurprisingly the most populated of any region of the US. More unexpected, though, is that trans people are actually 20% more likely to live in the South when compared to their cis counterparts. This means that nearly half of trans people in the United States live in the region that is the most hostile to them by a large margin.
While this number is sobering on its own, accounting for other factors, such as race and ethnicity, only worsens the situation: the South not only has the largest population of trans people, but the largest population of Black trans people.
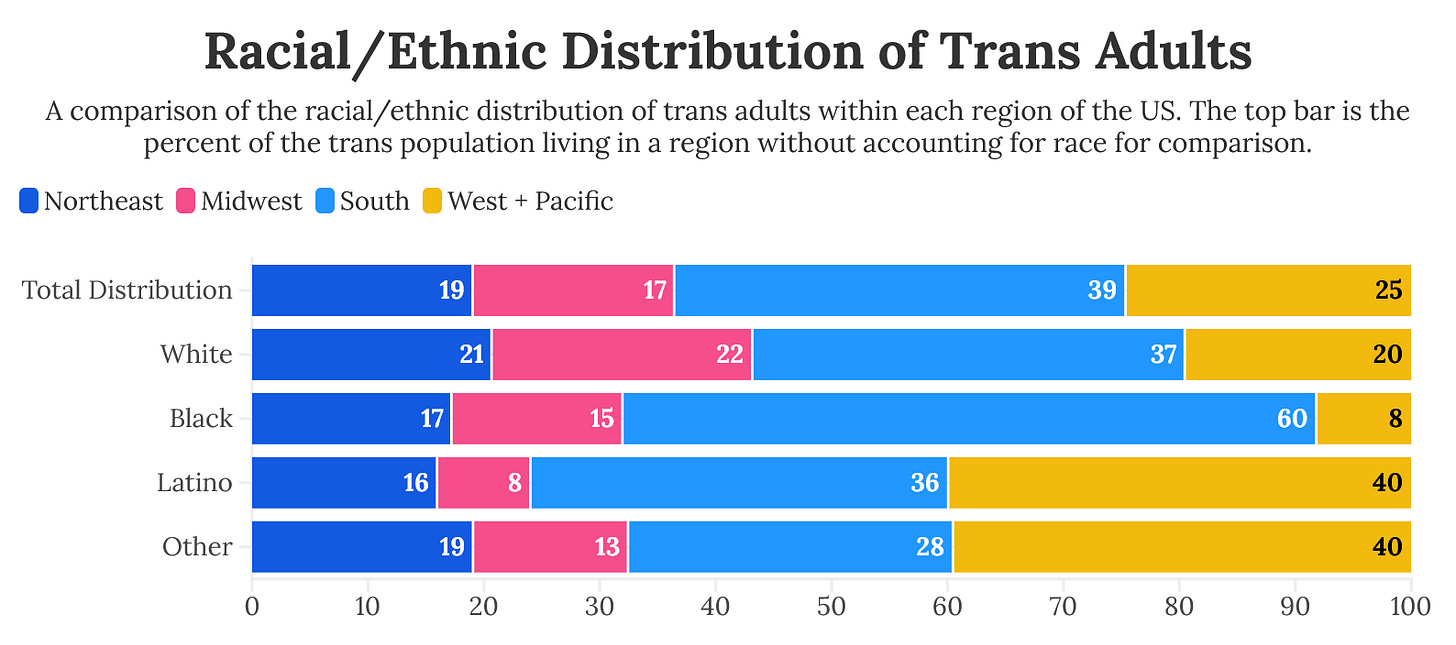
Black trans adults are 1.5 times more likely than other trans adults to live in the South. Once again, this is not necessarily surprising; a similar number of Black cis people are found in the South, as well. However, this means that Black trans people disproportionately suffer the effects of anti-trans policies. Meanwhile, the only racial/demographic of trans adults overrepresented in the Northeast are white people.
This distribution is, of course, an outcome of the deeply entrenched racism within the United States. The history of slavery, genocide, segregation, policies around immigration and movement, labor, and trade plays a large role in shaping the human geography of the country. What is crucial to note, though, is how the increased policing of trans people will compound upon other forms of policing.
Take, for instance, Executive Order 14168 signed by Donald Trump in January of 2025. Part of this executive order mandates that trans women incarcerated in federal prisons must be placed in male facilities and bans the use of federal dollars to pay for any kind of gender-affirming care within correctional facilities. While this is a bad policy for all trans people, it ultimately only affects those who are in federal prisons. Even without the stipulation targeting trans women specifically, a 2011 study by the National Center for Transgender Equality (now Advocates for Trans Equality, or A4TE for short) found that 1 in 5 trans feminine individuals reported a previous history of incarceration as compared to 1 in 10 trans masculine individuals. Additionally, trans feminine respondents were 4 times as likely to serve over six months in prison. The same report also found that about 1 in 8 white trans people had experienced incarceration as opposed to 1 in 2 Black trans people. A 2017 report confirmed this discrepancy with the finding that Black trans women were 3 times more likely to be incarcerated than white trans women. Indigenous, multiracial, and Latine trans people also experienced exacerbated rates of incarceration.
This is to say that while Executive Order 14168 is bad for all trans people, trans women of color are the most likely to suffer from its implementation. The astounding levels of incarceration facing trans women of color are no doubt related to elevated rates of poverty and racist policing practices in addition to transmisogyny. Similarly, if anti-trans policies become bolder in their aim to criminalize transness itself, and if these policies are far more likely to be implemented in Southern states, then the Policy Crisis will only further intensify the marginalization of not just trans people as a whole, but of racialized trans people especially. These policies will also impact the impoverished and working class the most and worsen wealth inequalities experienced by trans people as the denial of employment opportunities, housing options, and access to public accommodations is enshrined in state statutes.
The Policy Crisis, then, becomes a matter of life and death. The overreliance on state-level executive and judicial actions in place of building a sustainable, grassroots political movement that can advocate successfully for and against laws ironically leaves trans people even more vulnerable than they were before. Over and over, a positive policy in one state inspires anti-trans laws in a different state -- and the latter state usually has a larger trans population. All the while, trans people and allies are politically alienated from one another by both city limits and state borders. While much of this is not necessarily the fault of trans rights activists, the failure to manifest a cohesive, national political movement leaves trans people with very few avenues to improve their situation.
TL;DR.
If all of that was too much to digest, here is a short and sweet summary:
Based on my methodology, the trans rights score for all US states peaked in 2021.
Between 2021 and 2024, the trans rights score for all US states dropped by 30%.
Anti-LGBTQ+ policies are 1.35 times more likely to be law than pro-LGBTQ+ policies, as opposed to being executive orders, agency regulations, or court rulings.
Over half of anti-trans policies are implemented in the Southern states while the same amount of pro-trans politics are implemented in the Northeastern states.
Nearly half of trans people live in the South, including 60% of Black trans people. Less than a quarter of trans people live in the Northeast and are disproportionately white.
Closing Thoughts
I am hesitant to offer solutions at the moment. There is a good reason for this: I simply have not finished providing my analysis of the three central problems facing the trans rights movement outside of rampant transphobia itself and their historical context. My suggestions will come at the end of this series when everything is ready to be synthesized.
With that said, there are still a few opportunities and optimistic points to keep in mind as we move forward. The first one is that the anti-trans backlash will come to an inevitable peak soon enough. This does not mean that anti-trans policies will disappear or that there will never be any new policies introduced. Instead, we can understand peaks as the end of a trend. The anti-trans backlash will remain but it won’t be so passionate. It could always return one day in the future when the circumstances allow it to re-emerge. But it will calm down. There is still plenty to live for, fight for, and accomplish within our lifetimes. At the very least, giving up will do absolutely nothing to stop it.
Secondly, despite my criticism about relying on policy-making outside of the legislative branch, those options are still beneficial for trans people. A good number of the most viciously anti-trans laws have been successfully challenged in court. In fact, some of the policies that counted towards anti-trans scores in my analysis are not actually implemented in practice due to the intervention of courts. While some states are appealing these rulings -- and some have also been successful in their appeals -- courts continue to play a tremendous role in protecting trans rights.
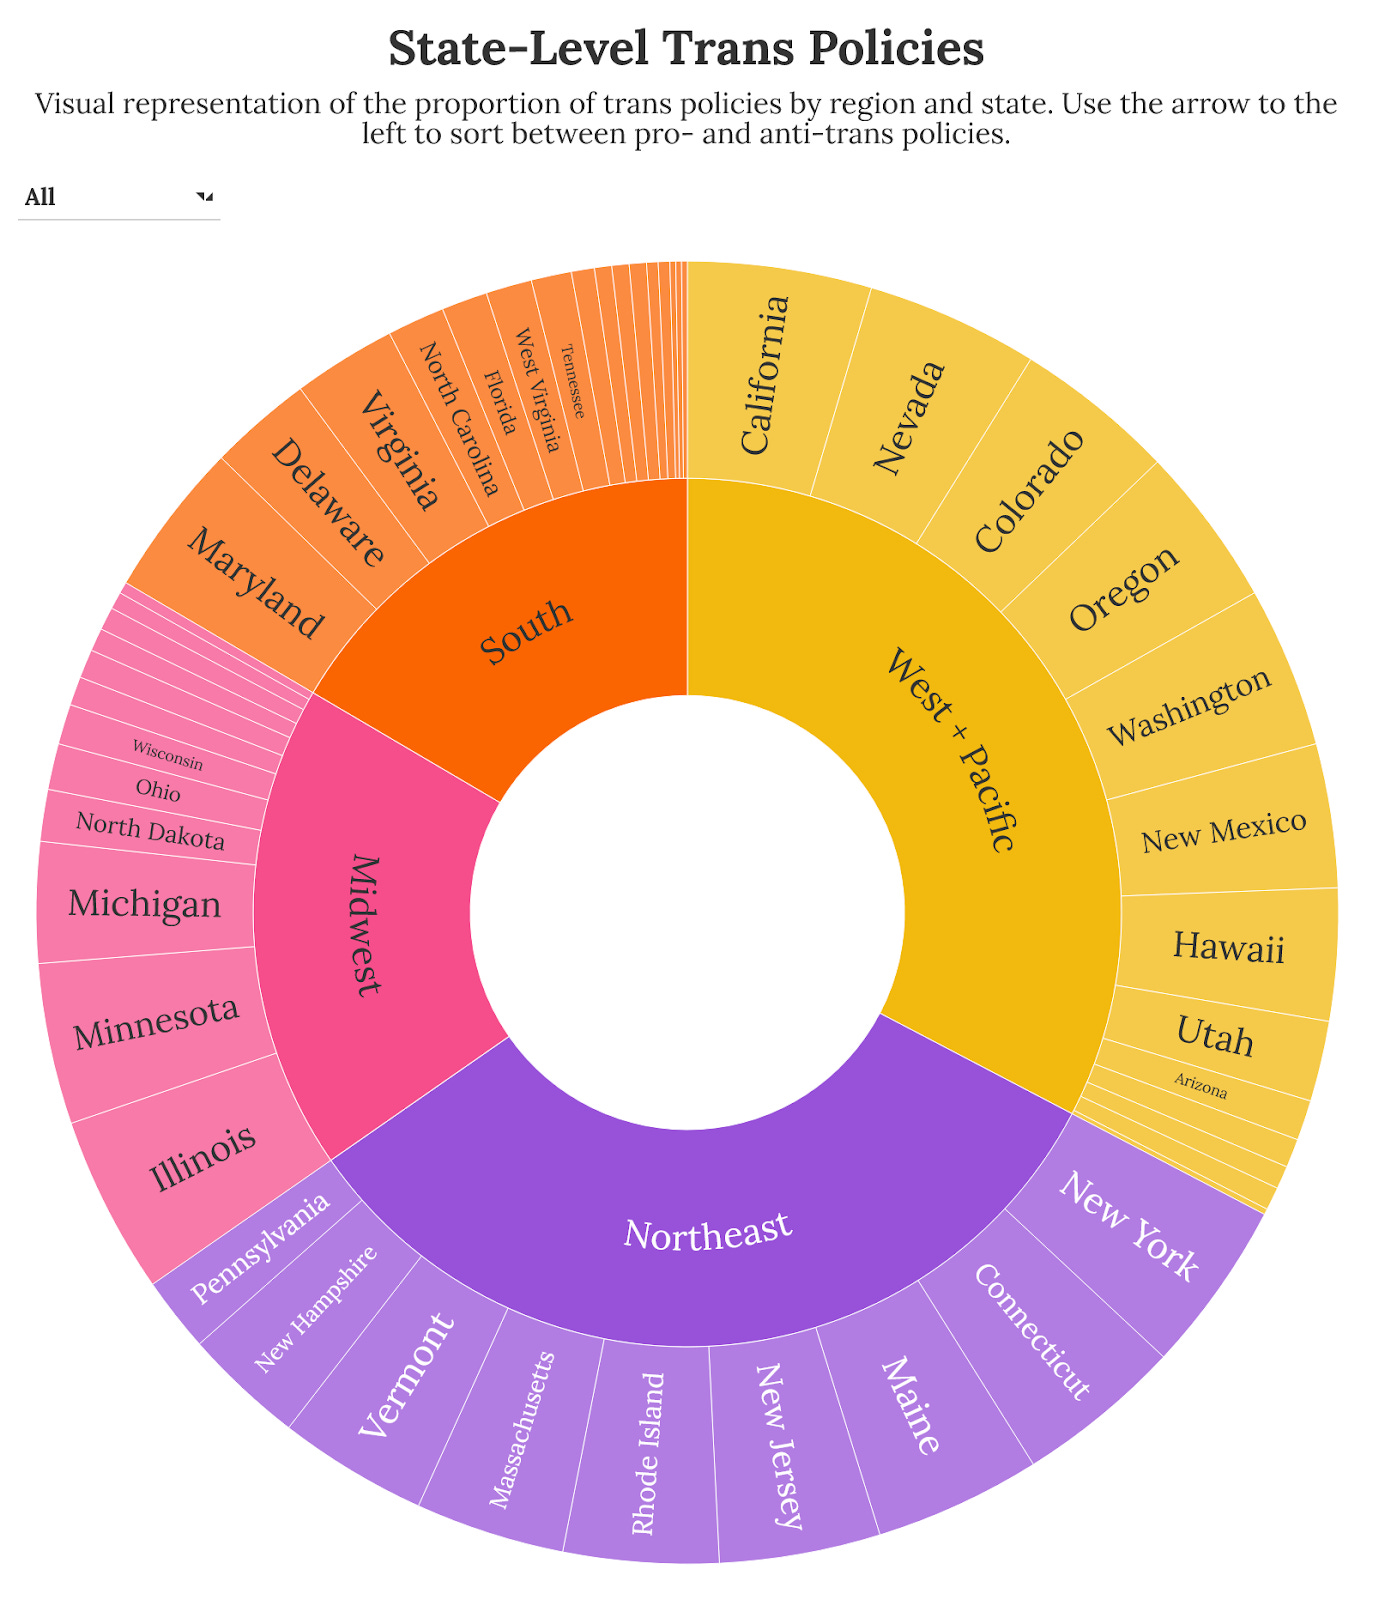
Thirdly -- and perhaps most importantly -- activists in states that are friendlier to trans rights need to start working immediately to establish more pro-trans laws. Provided below is a visualization of the total number of trans policies per state. I encourage you to look at it and get an idea of how active each state is when it comes to trans policies and the stance it generally takes towards them. In the Additional Information section of this article, I also share a link to the list of policies I used in my analysis to offer an idea of what areas could be improved in a particular state. You can find it under the subheading “Chart Links.”
Finally, we must remember that electoral politics and legislative change within a liberal system will never be enough to fully liberate trans people, or any other oppressed group for that matter. The bourgeois democracy of the United States is built upon the very same principles and mechanisms that rob trans people of our right to autonomy and dignity. This does not mean that fighting for policy change is not worth our time or energy. In fact, it’s quite the opposite: fighting for policy change prevents us from being politically marginalized any further. Additionally, through effective and intelligent leadership, we can amass and educate a political power so great that when that moment of revolution comes at last, trans people and our allies will be ready to answer the call.
I do what I do for free because I believe it’s important. With that said, I did put hundreds of hours of work into this. If you feel so inclined to tip, you can do so here. Your readership is immensely appreciated, with or without a tip.
Additional Information
Methodology
For this project, I analyzed 58 policy categories. These categories include family law, healthcare, discrimination, criminal justice, identity documents, the education system, and public accommodations. My method of recordkeeping was simple: if a state implemented a policy, I documented the year it was adopted and assigned it a point value for each year it was in place. If that policy was removed, then the state would stop earning points based on that policy from that year forward.
To gather the necessary data, I utilized the Wayback Machine to look at archived versions of the Equality Map. This allowed me to collect the bulk of the information I needed. If I was uncertain about the year that a certain policy went into effect, I often looked at the references section for the Wikipedia page regarding LGBTQ+ rights in that specific state or other resources provided by organizations like A4TE. For policies related to HIV/AIDS, I used information provided by the HIV Justice Network and a paper published by the Centers for Disease Control and Prevention and the Department of Justice. For sodomy laws, I relied on William Eskridge’s Gaylaw: Challenging the Apartheid of the Closet for the timelines of many states.
After collecting my data, I divided each policy based on whether it contributed to the SO Score or the GI Score. Given the overlap between gay rights and trans rights, many policies impacted both scores. However, I ultimately chose to score them separately as some policies did impact one and not the other. Additionally, some policies initially covered sexual orientation and only added gender identity years after the fact. To account for these differences, the SO and GI components of a policy were counted separately.
When it came to scoring, I adhered to the following conditions:
Each policy that advanced LGBTQ+ rights earned 1 point. Those that worsened LGBTQ+ rights earned -1 point.
Only the initial implementation of a policy counted. For instance, if a state passed two laws in two different years that protect trans people from discrimination in public accommodations, then it would only earn points from the first law.
Policies that significantly expanded on a category earned more than one point. For example, if a state requires surgery to change the gender marker on a driver’s license, it would earn -1 point. If it banned the ability to change a gender marker altogether, it would earn -2 points since that policy is more severe than the former. Similarly, a state that banned same-sex marriage in both its statutes and its constitution earned a point for each ban since the latter is much more serious than the former.
Policies that are being challenged in court but have not been officially repealed or revoked still count as active policies that earn points. For instance, while same-sex marriage is legal in all 50 states, states that have not officially removed their anti-same sex marriage laws continued earning negative points for them even after 2015.
If a policy was officially rescinded but then re-implemented, then the state would earn points on all years the policy was in effect. Let’s say that a state had an anti-discrimination policy in effect from 2004 to 2007, when it was repealed. That policy returned in 2012 and was repealed again in 2022. It would earn a total of 13 points overall from that policy.
Once a year received all its points, they were added together to get the Raw Score.
In order to determine the final score, I had to turn the Raw Score into percentages. To do this, I first had to calculate the maximum possible score and the minimum possible score based on which policies it was possible for states to have. My usage of the word “possible” refers to the fact that some policies only began appearing in response to other policies. Case in point, many states have passed trans-specific “shield laws” in response to gender-affirming care bans. As these shield laws only began appearing in 2022, it would be unfair to expect states to have this policy in place prior to that point. Therefore, when calculating the maximum score before 2022, shield laws did not contribute to this total.
After finding the maximum and minimum possible scores, it was time to calculate the percentage. Any Raw Score that was greater than or equal to zero was divided by the maximum score while Raw Scores that were less than zero were divided by the minimum score. The resulting quotient was then multiplied by 100. I chose this method as opposed to another method like min-max scaling as I wanted to make it clear when a state had more anti-LGBTQ+ policies in place than pro-LGBTQ+ policies -- that is, states that were more pro-LGBTQ+ had positive scores while anti-LGBTQ+ states had negative scores. This method also better demonstrates the proportion of pro-LGBTQ+ policies vs anti-LGBTQ+ policies since the former generally outnumbers the latter by a significant amount each year. For instance, if there were 10 possible pro-LGBTQ+ policies and only 4 possible anti-LGBTQ+ policies, then 2 out of 10 is a much smaller ratio than 2 out of 4. A 20% score would reveal that a state is more likely to be pro-LGBTQ+ but had a significant distance left to go, while a -50% score would reveal that this state is very likely to be anti-LGBTQ+.
To demonstrate how this process worked, here is an example: in 2014, the maximum score for the entire United States was 3,100 while the minimum score was -1,700. It scored 411 that year, resulting in a Total Score of 13.26 ((411/3100)*100). This score tells us two things. Firstly, because it is positive, we know that there were generally more pro-LGBTQ+ policies than negative ones in 2014. Secondly, given that it scored 13.26 out of 100, we also know that there was substantial room for growth.
After calculating the score with all policies included, I then removed every policy that wasn’t a law and ran my calculations again. The Law Only calculation is done exactly the same as the All Policies calculation.
When it came to calculating the percentage of policies that are laws, I did make one notable change: all policies were worth one point only. Take, for instance, the case I provided earlier about gender marker changes on driver’s licenses. While one received -2 points in the initial calculation, both policies were given the same value of -1 for this calculation. This was done to better reflect the actual number of policies and laws in place as opposed to the severity of specific policies. These values were also used for the Distribution of Trans Policies and State-Level Trans Policies charts.
Chart Links
Below are links to all the charts I made as well as the list of policies I surveyed for this article.
Useful Tools for Policy Tracking
References
Eskridge, William N. Gaylaw: Challenging the Apartheid of the Closet. Harvard University Press, 1999. https://doi.org/10.2307/j.ctvjz82vn.
HRC Foundation. “Equality from State to State & State Equality Index Archives.” Human Rights Campaign, n.d. https://www.hrc.org/resources/equality-from-state-to-state.
Herman, Jody L., Andrew R. Flores, and Kathryn K. O’Neill. How Many Adults and Youth Identify as Transgender in the United States? Williams Institute, 2022. https://williamsinstitute.law.ucla.edu/wp-content/uploads/Trans-Pop-Update-Jun-2022.pdf.
HIV Justice Network. “USA.” HIV Justice Network, n.d. https://www.hivjustice.net/country/us/?.
Ghandnoosh, Nazgol and Celeste Barry. One in Five: Disparities in Crime and Policing. The Sentencing Project, 2023. https://www.sentencingproject.org/reports/one-in-five-disparities-in-crime-and-policing/.
Grant, Jaime M., Lisa A. Mottet, Justin Tanis, Jack Harrison, Jody L. Herman, and Mara Keisling. Injustice at Every Turn. National Center for Transgender Equality, 2011. https://transequality.org/sites/default/files/docs/resources/NTDS_Report.pdf.
Lehman, J. Stan, Simon C. Gray, Jonathan H. Mermin, Meredith H. Carr, Allison J. Nichol, Alberto Ruisanchez, David W. Knight, and Anne E. Langford. “Prevalence and Public Health Implications of State Laws that Criminalize Potential HIV Exposure in the United States,” AIDS and Behavior 18, no. 6 (2014): 997 - 1006. https://archive.ada.gov/hiv/HIV-criminalization-paper.htm.
Movement Advancement Project. “Snapshot: LGBTQ Equality By State.” Movement Advancement Project, 2025. https://www.lgbtmap.org/equality-maps.
Reisner, Sari L., Zinzi Bailey, and Jae Sevelius. “Racial/Ethnic Disparities in History of Incarceration, Experiences of Victimization, and Associated Health Indicators Among Transgender Women in the U.S,” Women Health 54, no.86 (2014): 750 - 767. https://pmc.ncbi.nlm.nih.gov/articles/PMC5441521/pdf/nihms857476.pdf.
U.S. Census Bureau, “AGE AND SEX,” 2020. American Community Survey, ACS 5-Year Estimates Subject Tables, Table S0101, 2020, accessed on January 31, 2025, https://data.census.gov/table/ACSST5Y2020.S0101?g=010XX00US$0400000&y=2020.
U.S. Census Bureau, “HISPANIC OR LATINO, AND NOT HISPANIC OR LATINO BY RACE,” 2020. Decennial Census, DEC 118th Congressional District Summary File, Table P9, 2020, accessed on January 31, 2025, https://data.census.gov/table/DECENNIALCD1182020.P9?q=race&g=010XX00US$0400000&y=2020.
U.S. Census Bureau, “TOTAL POPULATION,” 2020. Decennial Census, DEC 118th Congressional District Summary File, Table P1, 2020, accessed on May 6, 2025, https://data.census.gov/table/DECENNIALCD1182020.P1?g=010XX00US$0400000&y=2020.
Wilson, Bianca D.M., Lauren J.A. Bouton, M. V. Lee Badgett, and Moriah L. Macklin. LGBT Poverty in the United States. Williams Institute, 2023. https://williamsinstitute.law.ucla.edu/wp-content/uploads/LGBT-Poverty-COVID-Feb-2023.pdf.


Oh this is incredibly helpful to read. I will def be considering assigning this and the rest of the series in my Trans Studies class this fall (if that is ok with you!!) also I’m fascinated, in the regional location of trans people chart, that there appear to be more trans adults than trans youth in the Midwest and West/Pacific, whereas in the Northeast and South it’s the opposite (more trans kids than adults)? I know it’s not the main point but I wonder why that is. Also, could you tell me where you got the data for the racial breakdown of trans people by region? I’m curious if the original has the “Other” category broken down (ofc I’m curious about the regional impacts on Native trans ppl) but I wouldn’t be surprised if it doesn’t. Thank you for doing this work!!!
hello, thank you for your work. I'm confused with your interpretation/explanation of the All Regions - All Policies Scores graph, specially where you write, "[...] and the South, whose GI score has never been higher than 0, by an astounding 13.84 points (nearly 800%)." How did you arrive at 800% and the other change percentages, as well? /gen